Vibration measurement theory
If you are new to vibration measurement, you can find a brief introduction to the most important topics here on this page.
What are vibrations?
UNIQUE, SMALL AND SIMPLE
Our two small handheld vibration meters VIBRIO M and VIBRIO EX are ideal for implementation in daily maintenance and rounds for maintenance personnel. The handheld vibration meter is good for assessing the condition of pumps, motors, fans, compressors, etc.
The vibration sensor is connected to the handheld vibration meter/data collector with a cable, the device is switched on, and you are ready to begin. It also has an expert system that can assist you in identifying faults, such as imbalance, misalignment, looseness, or bearing damage. An IR temperature meter is also built in.
What makes this device unique is that, even though it is a simple device, it comes with software for more advanced vibration analysis. You can set up a fixed route with measurement points in the free software, so all you have to do is follow the instructions shown on the vibration meter's screen. This vibration meter uses batteries, so if it runs out of power, they can be replaced quickly and easily.
NO ADVANCED SETTINGS: You do not need to make any advanced settings on the measuring instrument. We have already done that for you!
Waveform and FFT
WaveformImagine shaking a vibration sensor up and down, exactly the same distance up and down and with the same force, thereby producing the top graph over time (a perfect sine wave). Or standing and measuring on a machine. This is the raw vibration signal, which is simply plotted on a graph over time on the x-axis with a specific force, also called the amplitude, on the y-axis. The amplitude itself has three SI units: Acceleration, Velocity, Displacement.
FFT (Spectrum): An FFT (abbreviation for Fast Fourier Transform) is created based on the raw signal from the vibration sensor, i.e. our waveform. Imagine again that you are standing with the sensor and shaking it up and down with exactly the same force, speed and distance. This gives us a sine wave signal, which has a frequency depending on how many times the sensor is shaken up and down in one second. And, of course, an amplitude depending on how violently the sensor is shaken.
With an FFT graph, you can separate different frequencies and thus clearly see and distinguish the various rotating components from each other and assess their condition.
Amplitude and units
Amplitude: It is measured along the Y-axis and in various units that can describe the movement/vibration. To describe a physical up and down movement, there are three physical characteristics we need to consider:
Acceleration [g]: Acceleration describes how quickly a movement/vibration accelerates and decelerates. Acceleration has the following characteristics:
- At low speeds, there is little acceleration.
- Acceleration is used at high frequencies.
- Acceleration is often used in high-speed machines, gearboxes and for bearing analysis.
- Acceleration is proportional to the forces inside the machine.
speed [mm/s]: Speed describes how fast a movement/vibration travels and is the most commonly used unit in vibration measurement because it has the following characteristics:
- Speed is best for measuring frequencies from 2-2000 Hz
- Speed is proportional to fatigue.
Projectile [mm]: Describes how far an object has moved, i.e. the movement from top to bottom, how far it is. Special characters:
- At low frequencies, the displacement can be high (low acceleration).
- at high frequencies, the displacement is low (acceleration is high)
- Displacement is best for frequencies below 10 Hz, or machines below 600 revolutions.
- Displacement is proportional to stress
RMS – simple vibration measurements
Vibrations can be described as a simple numerical value and easily converted into a trend using an overall RMS (Root Mean Square) measurement, which can then be referenced to an alarm limit. Such a value actually describes the energy content and, in short, how much it vibrates, but not what vibrates or why.
This value provides an overall value, and over time, this trend level is expected to rise if an error begins to occur. However, this has its limitations, and one should not rely solely on a single numerical value.
Waveform and FFT
WaveformImagine shaking a vibration sensor up and down, exactly the same distance up and down and with the same force, thereby producing the top graph over time (a perfect sine wave). Or standing and measuring on a machine. This is the raw vibration signal, which is simply plotted on a graph over time on the x-axis with a specific force, also called the amplitude, on the y-axis. The amplitude itself has three SI units: Acceleration, Velocity, Displacement.
FFT (Spectrum): An FFT (abbreviation for Fast Fourier Transform) is created based on the raw signal from the vibration sensor, i.e. our waveform. Imagine again that you are standing with the sensor and shaking it up and down with exactly the same force, speed and distance. This gives us a sine wave signal, which has a frequency depending on how many times the sensor is shaken up and down in one second. And, of course, an amplitude depending on how violently the sensor is shaken.
With an FFT graph, you can separate different frequencies and thus clearly see and distinguish the various rotating components from each other and assess their condition.
Amplitude and units
Amplitude: It is measured along the Y-axis and in various units that can describe the movement/vibration. To describe a physical up and down movement, there are three physical characteristics we need to consider:
Acceleration [g]: Acceleration describes how quickly a movement/vibration accelerates and decelerates. Acceleration has the following characteristics:
- At low speeds, there is little acceleration.
- Acceleration is used at high frequencies.
- Acceleration is often used in high-speed machines, gearboxes and for bearing analysis.
- Acceleration is proportional to the forces inside the machine.
speed [mm/s]: Speed describes how fast a movement/vibration travels and is the most commonly used unit in vibration measurement because it has the following characteristics:
- Speed is best for measuring frequencies from 2-2000 Hz
- Speed is proportional to fatigue.
Projectile [mm]: Describes how far an object has moved, i.e. the movement from top to bottom, how far it is. Special characters:
- At low frequencies, the displacement can be high (low acceleration).
- At high frequencies, the displacement is low (acceleration is high).
- Displacement is best for frequencies below 10 Hz, or machines below 600 revolutions.
- Displacement is proportional to stress
RMS – simple vibration measurements
Vibrations can be described as a simple numerical value and easily converted into a trend using an overall RMS (Root Mean Square) measurement, which can then be referenced to an alarm limit. Such a value actually describes the energy content and, in short, how much it vibrates, but not what vibrates or why.
This value provides an overall value, and over time, this trend level is expected to rise if an error begins to occur. However, this has its limitations, and one should not rely solely on a single numerical value.
Frequency
We assume that the time on the x-axis is 1 second. The upper graph is called the time signal/Time Waveform and the lower one is called the frequency spectrum/FFT.
If we take the same vibration signal from before and count the “bumps” on the graph, we get the frequency (Hz). In other words, how many times did an event occur in 1 second (Hz), how many times did the sensor move up and down.
This frequency can be read on the time signal over time, but we can also plot it as shown under the sine signal with a spectrum (FFT). Where we change the axis value on the x-axis to frequency.
This proves useful when multiple signals are mixed together, as each component inside the machine has its own frequency.
Increased frequency
We assume that the time on the x-axis is 1 second.
We have now doubled the frequency, so there are now twice as many “humps” on our hour waveform. There are now 20 pulses in 1 second.
Look closely at the bottom graph (spectrum – FFT). The frequency has moved further out on the x-axis, so that it now corresponds to a frequency of 20Hz.
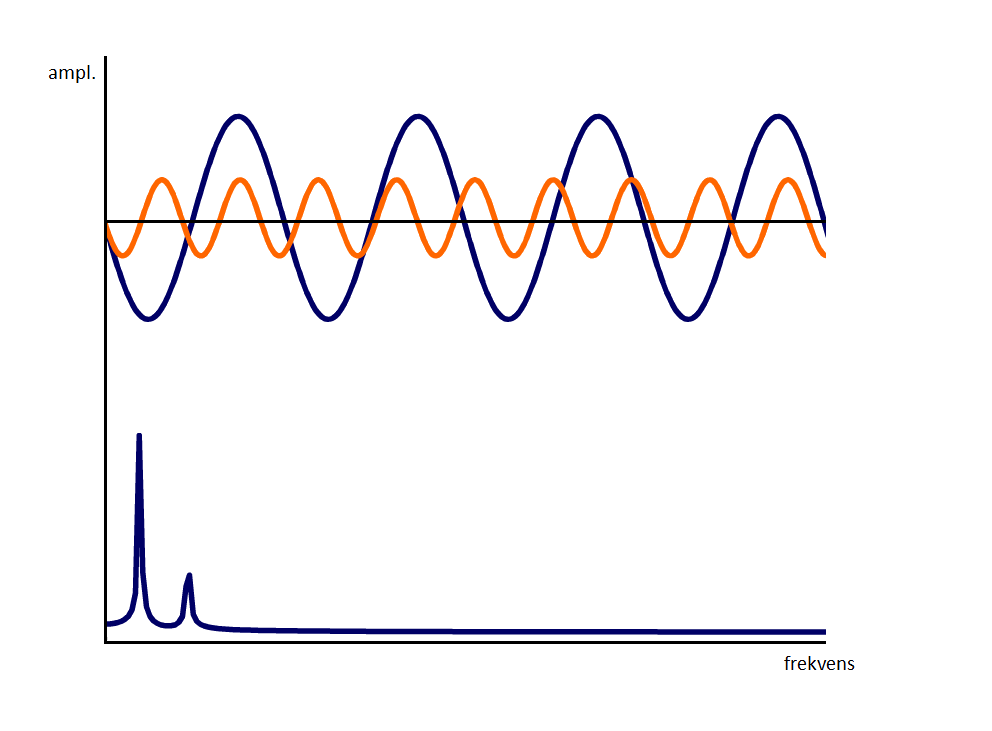
Multiple frequencies
Machines have many different components and rotational speeds. This makes things a little more complicated when multiple frequencies are mixed together, as shown in the graph.
Machines contain components such as gears, bearings, fan blades and many other components that generate vibrations. Each of these components vibrates in its own way and has its own frequency, which we can divide into our spectrum.
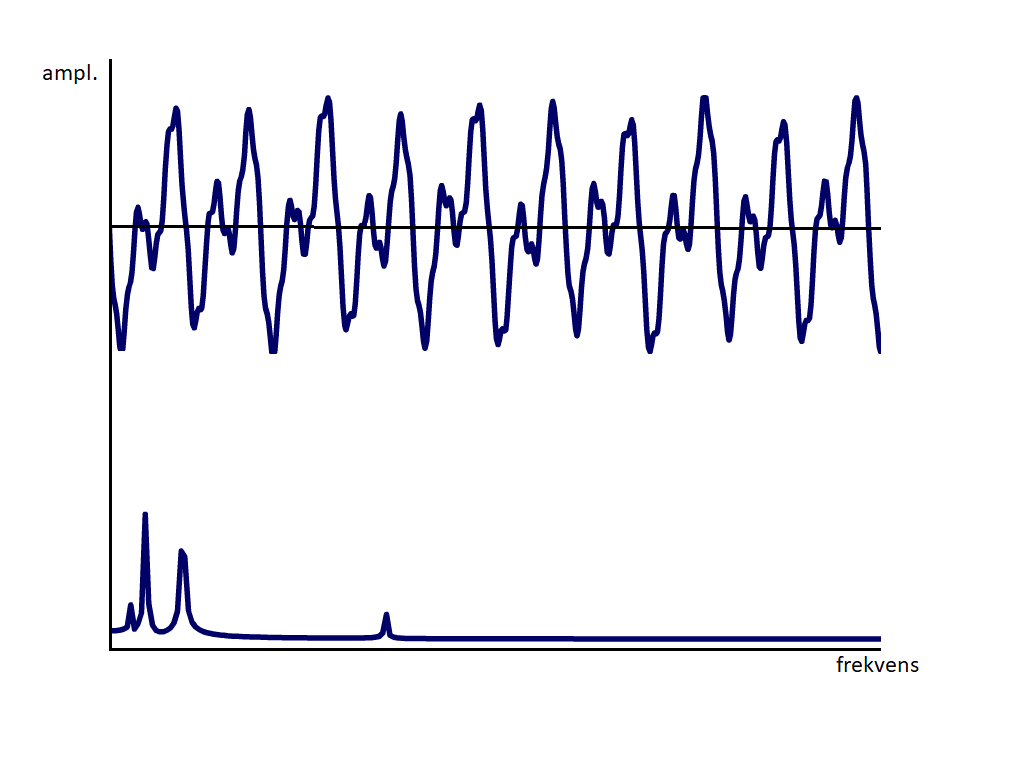
It immediately becomes more complicated when it is a real vibration signal and not a perfect sine wave as we have used in the examples.